

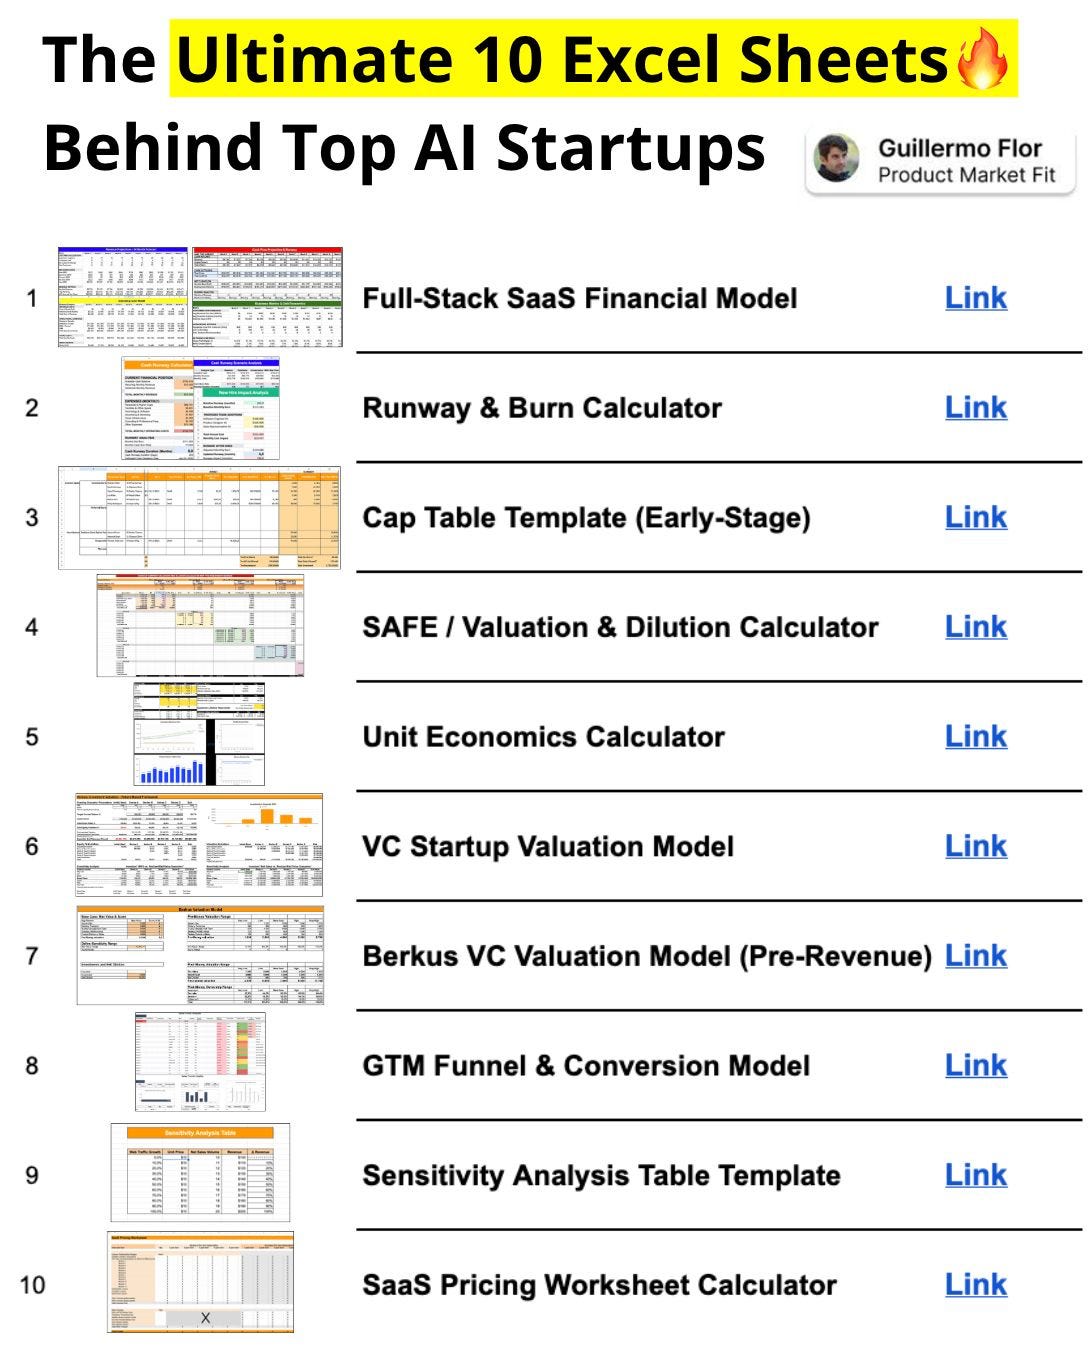
The 10 Excel Templates Every SaaS & AI Founder Needs to Build, Survive, and Scale 🔥
The spreadsheets that decide whether you know the ins and outs of your startup 🚀

Startups don’t fail in dramatic ways, but they fail quietly, inside spreadsheets no one is really looking at.
Either runway disappears faster than expected, dilution compounds invisibly, growth looks healthy until unit economics say otherwise, and pricing caps upside long before product market fit ever settles.
The difference between founders who survive and founders who don’t isn’t intelligence or ambition, but knowing whats happening.
These are the exact models used to:
Understand whether growth creates value or accelerates burn
Make hiring and pricing decisions with conviction
Avoid irreversible ownership mistakes
Stress-test assumptions before the market does
Use these to run the business first.
Table of Contents
1. Full-Stack SaaS Financial Model (Investor-Ready)
→ Growth, costs, unit economics, and cash — all in one system
2. Runway & Burn Calculator
→ Survival math, hiring impact, and scenario planning
3. Cap Table Template (Early-Stage)
→ Ownership, dilution, and control — fully diluted
4. SAFE / Valuation & Dilution Calculator
→ How SAFEs convert and what they really cost you
5. Unit Economics Calculator (CAC / LTV / Payback)
→ Is growth compounding — or leaking?
(Template by Maxio)
6. VC Startup Valuation Model (VC Method)
→ How investors price risk, time, and outcomes
7. Berkus VC Valuation Model (Pre-Revenue)
→ Valuation before traction, grounded in risk reduction
8. Go-To-Market Funnel & Conversion Model
→ From leads to revenue — where growth actually happens
9. Sensitivity Analysis Table
→ Which assumptions matter and where the business breaks
10. SaaS Pricing Worksheet Calculator
→ Pricing architecture, not guesswork
Lets get to it 🔥
1. Full-Stack SaaS Financial Model Template (Investor-Ready)
A good founder is one that knows his numbers. This template gives you a clear view of growth, costs, and cash that stress-tests whether scaling creates value or just accelerates burn.
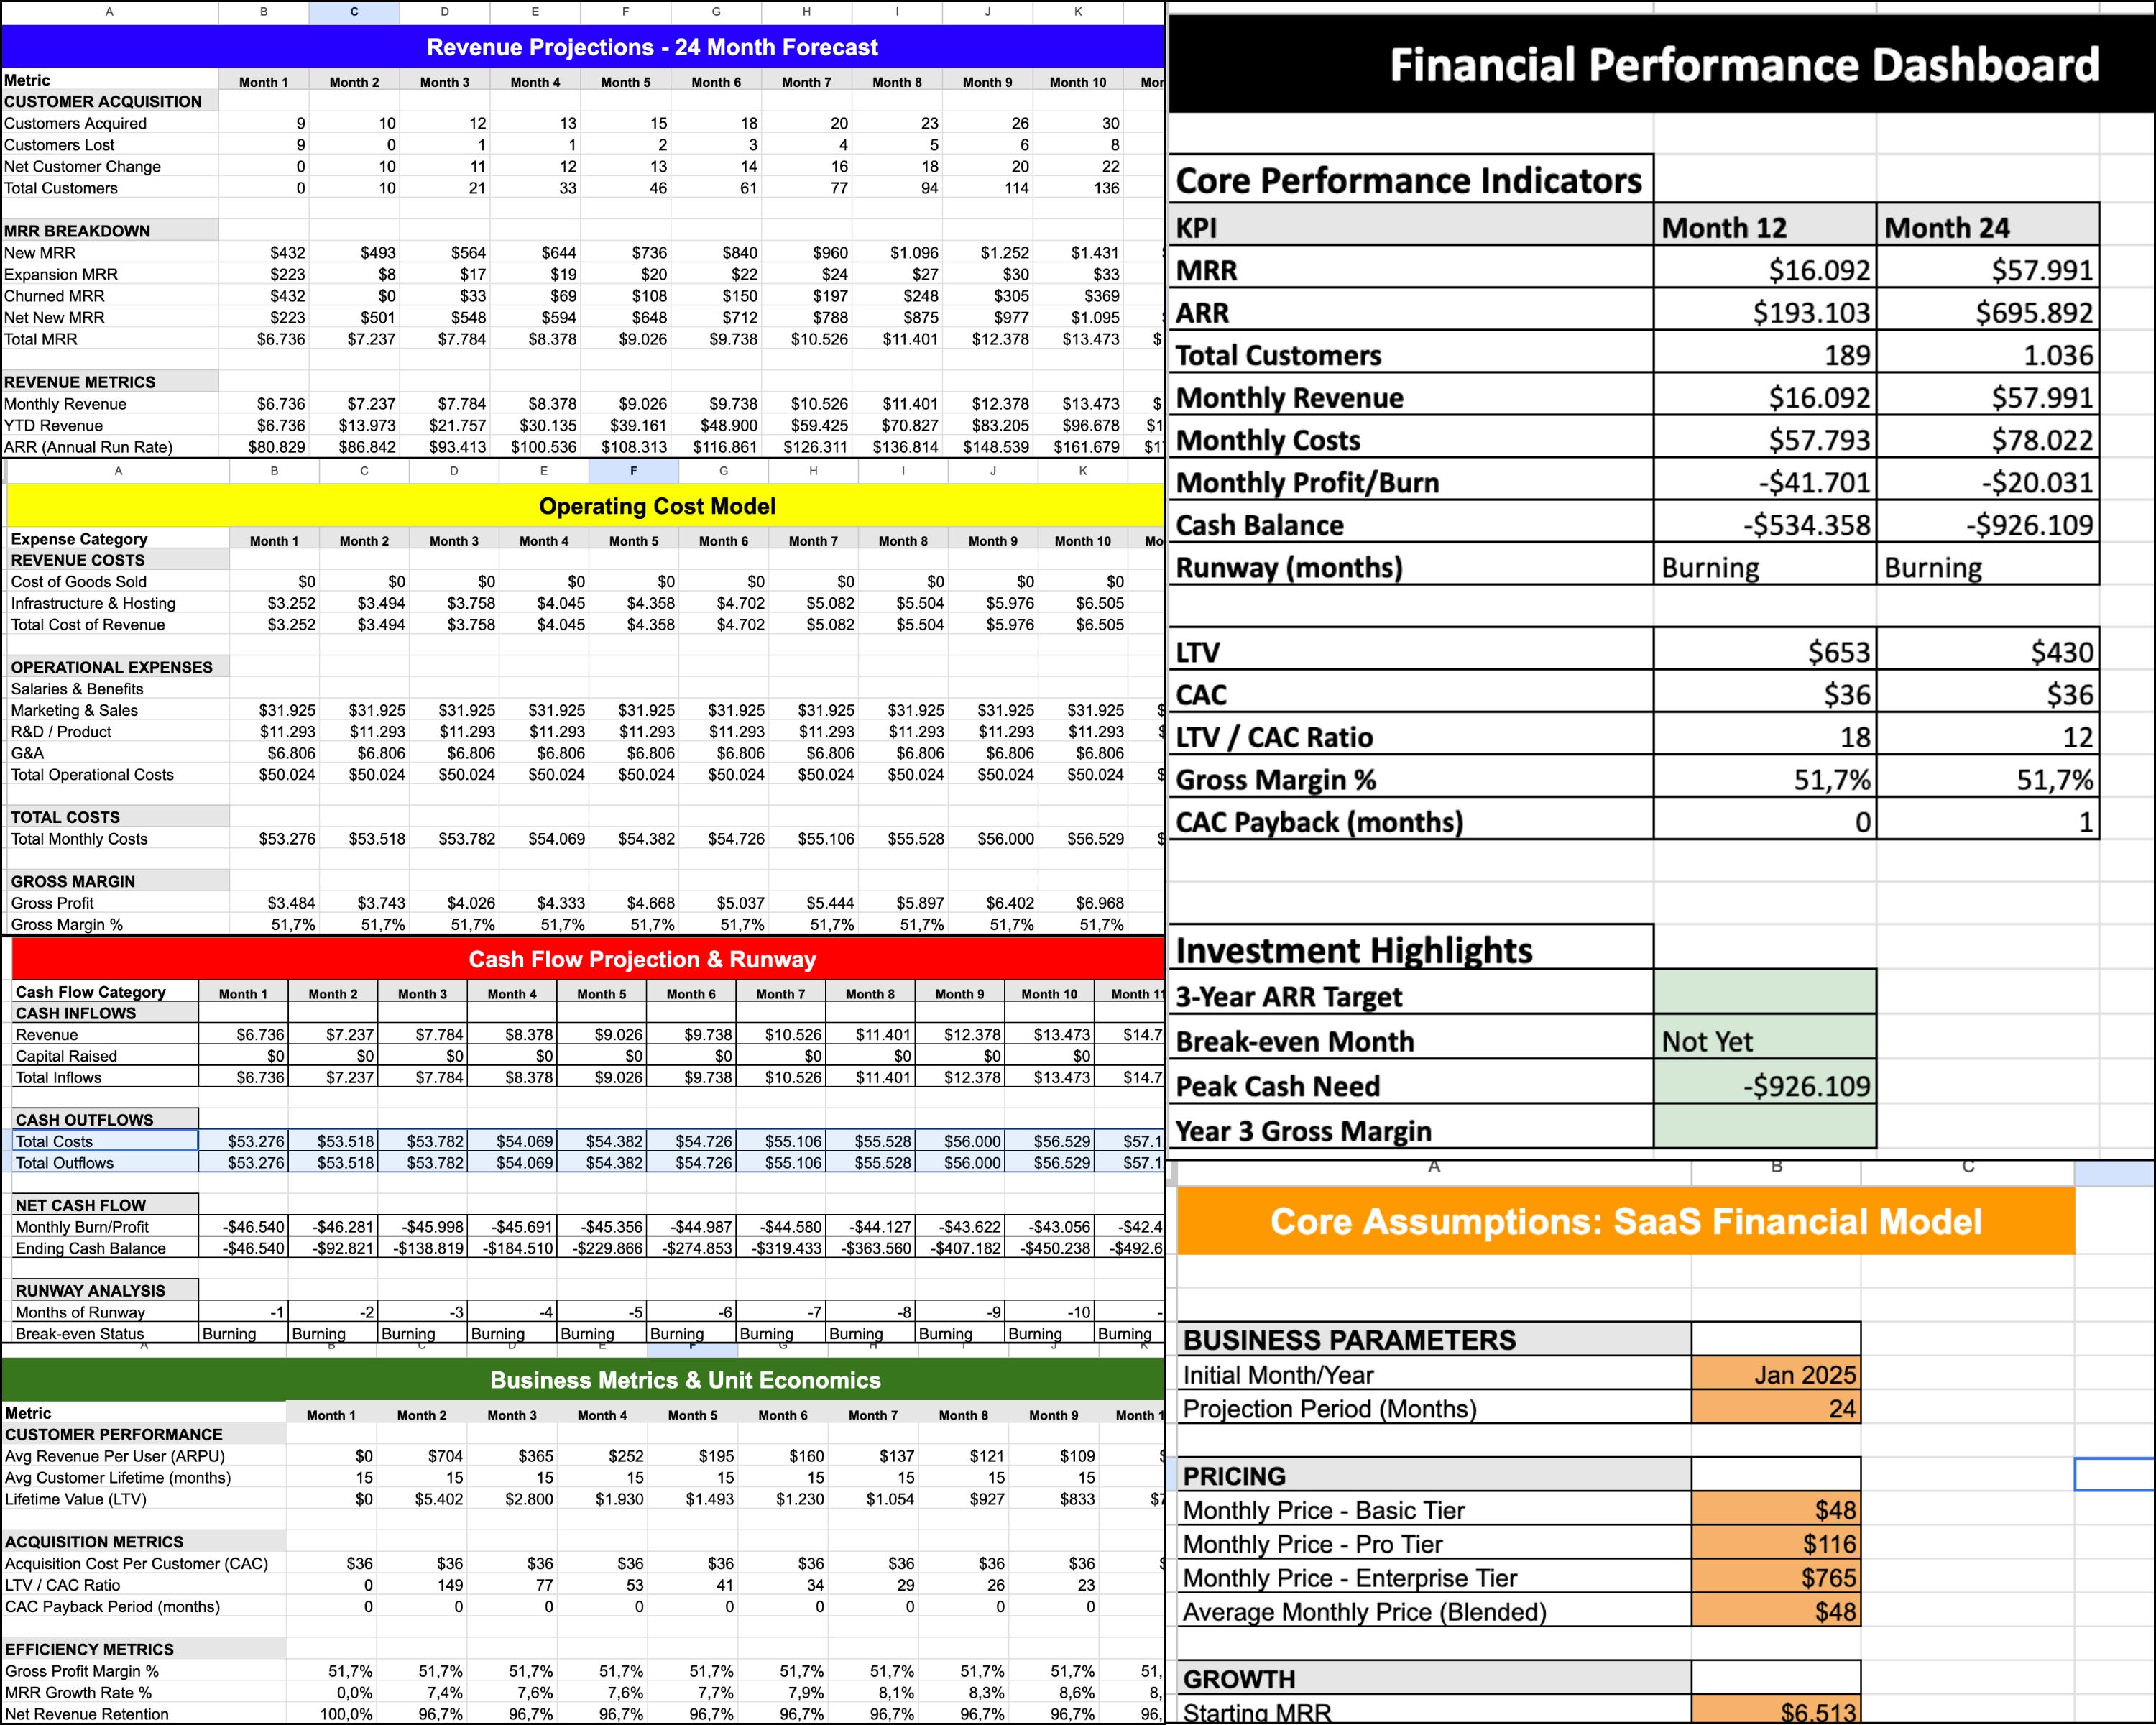
Operating & Decision Layer
This model ties revenue, costs, unit economics, and cash into a single system, showing whether growth compounds value or accelerates burn. The dashboard then compresses this into clear outcomes (runway, break-even timing, peak cash need, and long-term scale) so decisions can be made quickly and with conviction.
ACCESS BELOW 👇
