

𝐓𝐡𝐞 𝐔𝐥𝐭𝐢𝐦𝐚𝐭𝐞 𝐆𝐏𝐓 𝐟𝐨𝐫 𝐕𝐢𝐫𝐚𝐥 𝐋𝐢𝐧𝐤𝐞𝐝𝐢𝐧 𝐈𝐧𝐟𝐨𝐠𝐫𝐚𝐩𝐡𝐢𝐜𝐬 🚀
Introducing Visionary AI: The Tool Behind My 1M+ LinkedIn Views

Hey everybody, welcome to the Product Market Fit Newsletter 🚀
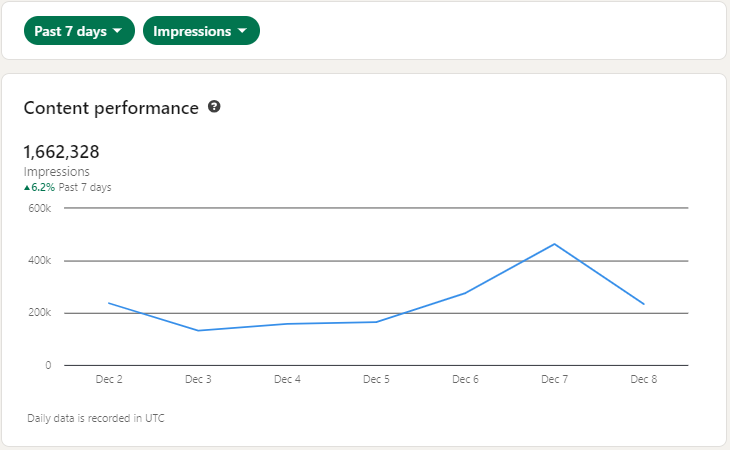
This week, I want to share something incredibly valuable: the exact method I’ve been using to consistently generate over 1 million weekly views on LinkedIn.
If you’ve seen my LinkedIn feed, you know that infographics are a cornerstone of my strategy.
They’re simple, impactful, and designed to grab attention in a crowded feed.
How to create infographics that go viral:
Step 1: Focus on Solving Real Problems

The first step is to deeply understand your audience. For me, that’s:
Startup founders struggling with fundraising, growth, and go-to-market strategies.
VC investors looking for insights on markets and startups.
Consultants and agencies working with founders to solve big challenges.
Ask yourself: What are the most pressing questions they’re trying to answer?
For example:
“What metrics do VCs care about most during fundraising?”
“How can founders create a better go-to-market strategy?”
These become the foundation for my infographics.
Step 2: Brainstorm Topics That Engage
Next, I brainstorm content ideas that will resonate with this audience. Here’s how:
I think about trends (e.g., fundraising challenges in a tough market).
I focus on tactical advice (e.g., “5 Mistakes Founders Make in Pitch Decks”).
I explore pain points (e.g., “Why Startups Fail to Scale”).

Step 3: Structure the Content for Impact
Every infographic I create follows a simple structure:
Headline: Grab attention with a promise of value.
Key Points: Include 3-5 actionable takeaways.
Visuals: Use simple, clean designs to enhance readability.
For example, if the topic is “5 Metrics VCs Look For,” the infographic might include:
Runway (months).
Revenue growth (YoY).
CAC-to-LTV ratio.
Churn rate.
NPS (Net Promoter Score).
This structure keeps the content concise and easy to consume.
Streamlining the Process with Visionary AI
After months of refining this framework, I realized something: manually brainstorming, structuring, and creating content for infographics takes time—time that founders, investors, and consultants often don’t have.
So, I streamlined it.
I trained a custom GPT, now called Visionary AI, using the exact process I’ve used to create infographics that have driven 40M+ impressions on LinkedIn.
Here’s what Visionary AI does:
Generates viral topics: Tailored to your audience’s needs.
Outlines content: With headlines, key points, and examples.
Optimizes captions: So your posts drive more engagement.
It doesn’t design the infographics, but it does all the heavy lifting to help you create content that resonates and performs. It’s the same tool I now use to hit 1M+ weekly impressions consistently.
